cuv’ner
A commanding view of your coverage
Cuv'ner is an amalgamation of several ideas I've been playing with for visualizing coverage data. It is specifically for Python coverage, as written by Coverage.py -- however, it's somewhat generic and there's no reason that coverage data of other languages couldn't also be visualized (fire me a PR!)
The most useful tools are the console ones, where you can set
up less to
show Pygments-highlighted code
background-coloured by coverage or view line-by-line graphs of all
the files with cuv graph. The best eye-candy comes
from the "graphic" visualizations, the SVG-based cuv
hist "histogram"-style one or the cuv pixel
"show every glyph" one. This allowed me to make a history
of txtorcon's coverage and code.
Trying it out is easy: pip install cuvner and then
type cuv readme to get started.
Similar tools exist for viewing coverage. One nice one is codecov'io's browser extension that shows colored coverage on GitHub as you browse a project. BeeWare has a GUI tool called Duvet that allows you to browse files with coverage highlighting.
I am not aware of any console tools like this, though, and I find
using less a really convenient way to confirm
my new test covers what I wanted it to cover...
- documentation from ReadTheDocs.org
- source code from GitHub
- demo from asciinema.org
Some more screen-shots:
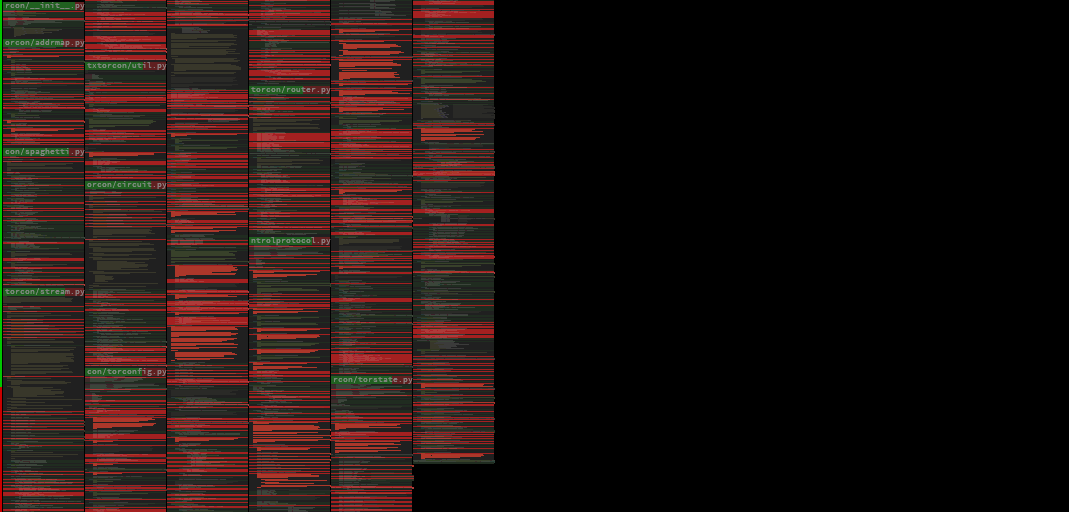
cuv graph running on Twisted's code.
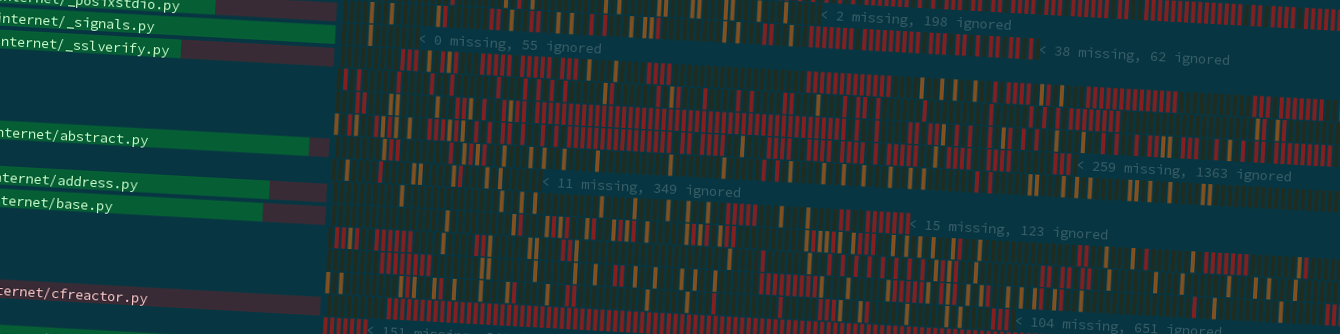
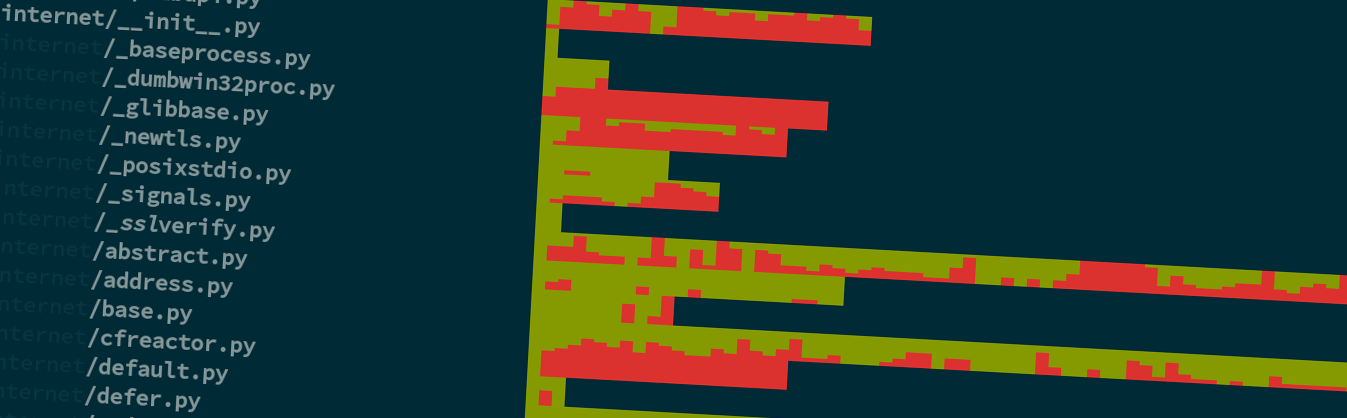
Part of cuv hist's output on Twisted code.
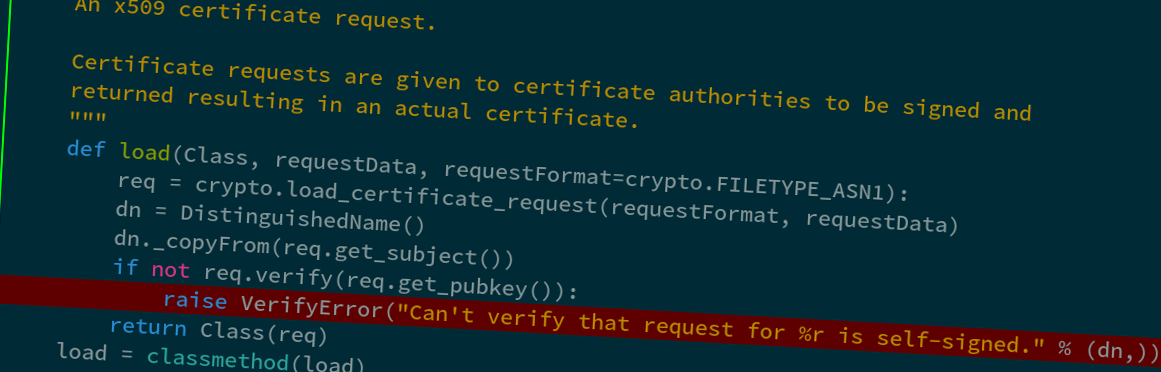
Using cuv lessopen to view a Twisted source file